P-V diagrams & Engines
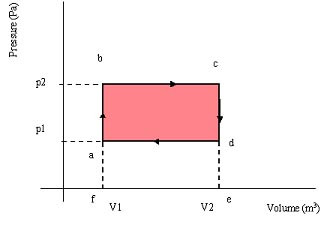
Gases undergo changes that will eventually cause them to return to the original state. An ideal gas undergoing these changes has the properties shown below:
- Isovolumetric changes between a & b and c & d
- Isobaric changes between b & c and d & a
Image
Thermal Efficiency: net work output ÷ heat input
Actual efficiency of the engine will be lower than the value of thermal efficiency alone, due to frictional losses within the engine. The efficiency of a car = approx. 30%
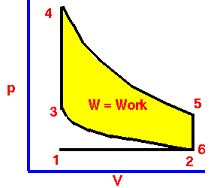
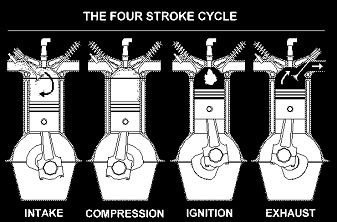
Petrol Engine: Otto Cycle
Image
Image
Diesel Engine:
- Higher thermal efficiency that petrol engines
- Heavier than petrol engines
- More noise and incomplete combustion (pollution)
Both Engines: power output: area of p-V loop x no cylinders x no cycles per sec
maximum energy input: fuel calorific value x fuel flow rate
Category