Spectra & Energy Levels
Line Spectra are the wavelengths of light emitted from an element when it's electrons lose energy. The energy is lost in the form of photons of certain wavelengths, which are different for each material.
A Line Spectrum can be create by passing current through an ionised gas.
An Absorption Spectrum is produced by shining white light through a sample of a gaseous element. The samples emission spectrum will be missing from the result due to the absorption of energy by electrons corresponding to the energy levels of the element.
When current is passed through hydrogen gas, the hydrogen spectrum is given as below:
Image
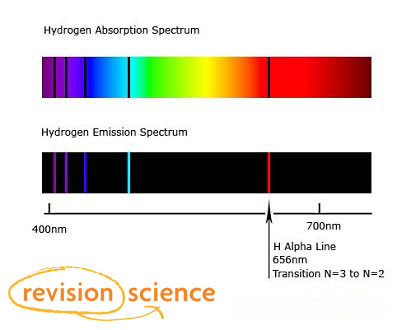
Line spectrum are unique for each element, and for each isotope of that element.
An energy level diagram shows the amounts of energy that electrons have at each level in an atom.
The energies are measured from a zero equivalent to a single free electron.
The diagram shows the energy levels in a hydrogen atom.
Image
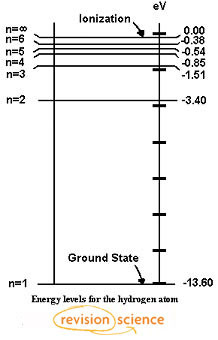
An orbiting electron has less energy than a free electron, so the energies are shown as negatives relative to the ground state.
An electron with the minimum possible energy is in the ground state; higher energy levels are called excited states. When an electron moves from an energy level E1 to a lower energy level E2 the energy of the photon emitted is given by: hf = E1 – E2