Distance-Time and Velocity-Time Graphs
This section explains distance-time and velocity-time graphs covering, acceleration, uniform motion and velocity formula and falling objects.
Distance-Time Graphs
A distance-time graph shows how the distance travelled by an object changing over time. The graph's x-axis represents time, and the y-axis represents distance.
Image
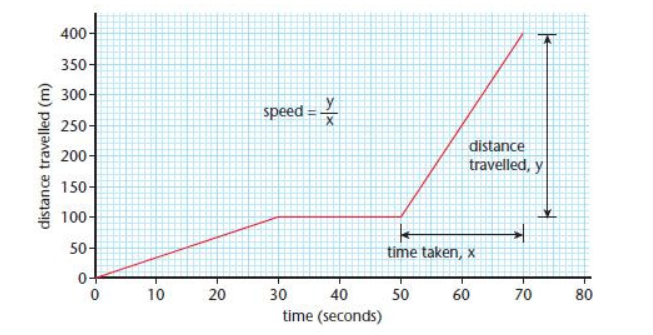
Key Features of a Distance-Time Graph
- A flat horizontal line indicates that the object is stationary (no movement).
- A straight diagonal line indicates that the object is moving at a constant speed.
- A curved line suggests that the object is accelerating or decelerating (changing speed).
The slope (steepness) of the line represents the speed of the object:
- A steeper slope indicates a faster speed.
- A gentler slope indicates a slower speed.
Example of Distance-Time Graph:
- If a person walks 10 metres in 5 seconds at a constant speed, the graph will show a straight line with a positive slope. The distance will increase steadily as time passes.
Acceleration
Acceleration is a measure of how quickly an object's velocity changes. It is a vector quantity, meaning it has both a magnitude and a direction. An object accelerates if its speed increases, decreases, or if it changes direction.
- Positive acceleration means the object is speeding up.
- Negative acceleration (also called deceleration) means the object is slowing down.
The formula for calculating acceleration is:
$$\text{Acceleration (a)} = \frac{\text{Change in velocity (Δv)}}{\text{Time taken (t)}}$$
Where:
- a is the acceleration in metres per second squared (m/s²).
- Δv is the change in velocity in metres per second (m/s).
- t is the time taken for the change in velocity in seconds (s).
Example of Acceleration:
If a car speeds up from 0 m/s to 20 m/s in 10 seconds, the acceleration can be calculated as:
$$a = \frac{\Delta v}{t}$$
$$a = \frac{20 \, \text{m/s} - 0 \, \text{m/s}}{10 \, \text{s}}$$
$$a = \frac{20}{10} = 2 \, \text{m/s}^2$$
So, the car's acceleration is 2 m/s².
Velocity-Time Graphs
A velocity-time graph shows how the velocity of an object changes over time. The graph’s x-axis represents time, and the y-axis represents velocity.
Image
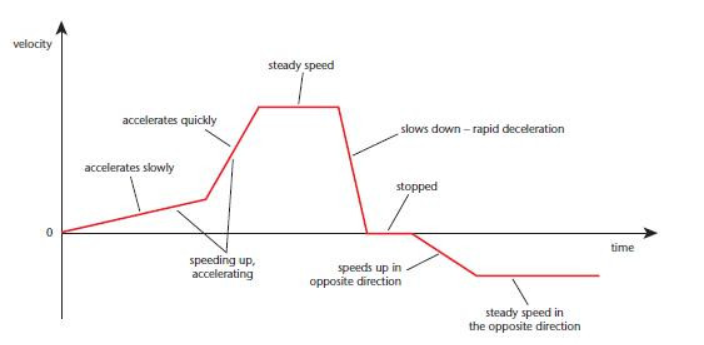
Key Features of a Velocity-Time Graph:
- A horizontal line indicates that the object is moving at a constant velocity (no acceleration).
- A sloping line indicates that the object is accelerating (the velocity is changing).
- A steeper slope indicates a greater acceleration.
- The area under the graph represents the distance travelled by the object.
Uniform Motion and Velocity Formula
In uniform motion, an object moves at a constant velocity, meaning it does not accelerate or decelerate. The velocity-time graph for uniform motion is a straight horizontal line.
The formula to calculate distance travelled in uniform motion is:
$$\text{Distance (d)} = \text{Velocity (v)} \times \text{Time (t)}$$
Example:
If a cyclist travels at a uniform velocity of 10 m/s for 20 seconds, the distance travelled is:
$$d = v \times t$$
$$d = 10 \, \text{m/s} \times 20 \, \text{s}$$
$$d = 200 \, \text{m}$$
So, the cyclist travels 200 metres.
Falling Objects
When an object falls freely under the influence of gravity, it accelerates due to the Earth's gravitational pull. The acceleration due to gravity is approximately 9.8 m/s² on Earth, which means the object's velocity increases by 9.8 m/s every second.
Key Features of Falling Objects:
- Initial velocity of a falling object is 0 m/s (if it starts from rest).
- The object accelerates at a constant rate (ignoring air resistance).
- Distance travelled and velocity both increase as the object falls.
Example of a Falling Object:
If an object is dropped from rest and falls under gravity for 3 seconds, the final velocity can be calculated using the acceleration formula:
$$v = u + at$$
Where:
- v is the final velocity in m/s.
- u is the initial velocity in m/s (0 m/s, since it starts from rest).
- a is the acceleration due to gravity (9.8 m/s²).
- t is the time in seconds.
Substituting values:
$$v = 0 + 9.8 \times 3$$
$$v = 29.4 \, \text{m/s}$$
So, the object's final velocity after 3 seconds is 29.4 m/s.
To calculate the distance fallen in that time, we can use the formula:
$$d = ut + \frac{1}{2}at^2$$
Where:
- d is the distance travelled in metres.
- u is the initial velocity (0 m/s).
- a is the acceleration due to gravity (9.8 m/s²).
- t is the time in seconds.
Substituting values:
$$d = 0 \times 3 + \frac{1}{2} \times 9.8 \times 3^2$$
$$d = \frac{1}{2} \times 9.8 \times 9$$
$$d = 44.1 \, \text{m}$$
So, the object falls a distance of 44.1 metres.
Key Points:
- Distance-time graphs show how distance changes over time, with the slope representing speed.
- Velocity-time graphs show how velocity changes over time, with the slope representing acceleration, and the area under the graph representing the distance travelled.
- Acceleration is the rate of change of velocity, calculated using the formula $a = \frac{\Delta v}{t}$
- Uniform motion involves constant velocity, with distance calculated by $d = v \times t$
- Falling objects experience acceleration due to gravity, and their velocity and distance can be calculated using the appropriate formulas.
Understanding these graphs and concepts is essential for analysing the motion of objects in GCSE Physics.
Category