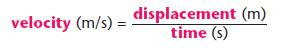
Speed, Velocity and Acceleration
Speed, velocity and acceleration
Speed and distance-time graphs
Speed is measured in metres per second (m/s) or kilometres per hour (km/h). If an athlete runs with a speed of 5 m/s, she will cover 5 metres in one second and 10 metres in two seconds. An athlete with a faster speed of 8m/s will travel further, 8m in each second, and will take less time to complete his journey.
Image

Direction of travel
There are two ways of looking at a journey:
- You can say that the distance you travel can only increase or stay the same, and then the speed is always a positive number.
- You can consider the direction you travel, so that if you travel towards school, that is a positive distance and when you travel in the opposite direction that is a negative distance. Sometimes, distance in a given direction is called displacement.
- You only need to know the term ‘displacement’ for Edexcel.
Quantities that have a magnitude and direction are called vectors.
Velocity is a vector, because velocity is speed in a given direction.
Example : A boy walks in a positive direction and then back again with a constant speed of 2 m/s, so he walks with a velocity of +2 m/s and then with a velocity of –2m/s.
Image
Distance–time graphs
On a distance–time graph:
- a horizontal line means the object is stopped
- a straight line sloping upwards means it has a steady speed.
The steepness, or gradient, of the line shows the speed:
- a steeper gradient means a higher speed
- a curved line means the speed is changing.
If the direction of travel is being considered:
- A negative distance is in the opposite direction to a positive distance.
- A straight line sloping downwards means it has a steady speed, and a steady velocity in the negative direction.
Image
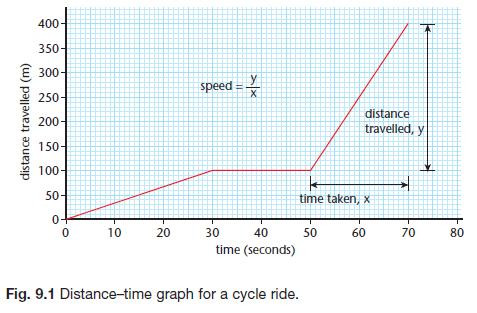
Between 30 s and 50 s the cyclist stopped. The graph has a steeper gradient between 50 s and 70 s than between 0 s and 20 s – the cyclist was travelling at a greater speed.
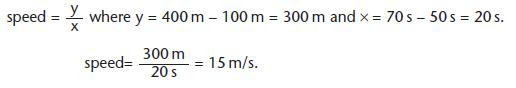
To calculate a speed from a graph, work out the gradient of the straight line section as shown above in Fig. 9.1:
Image
Average speed and instantaneous speed
You can calculate the average speed of the cyclist for the total journey in Fig 9.1 above using:
Image
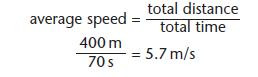
This is not the same as the instantaneous speed at any moment because the speed changes during the journey. If you calculate the average speed over a shorter time interval you get closer to the instantaneous speed.
This video explains about distance and acceleration
Velocity–time and speed–time graphs
A change of velocity is called acceleration. Speeding up, slowing down and changing direction are all examples of acceleration. Fig. 9.2 shows how to interpret a velocity–time graph.
Image
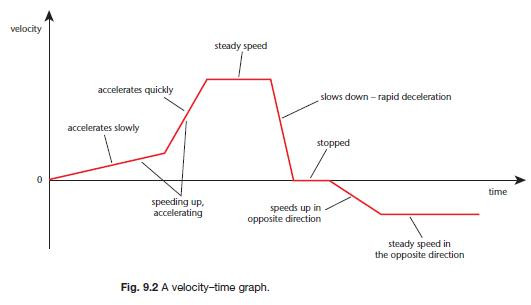
- A positive slope (gradient) means that the speed is increasing – the object is accelerating.
- A horizontal line means that the object is travelling at a steady speed.
- A negative slope (gradient) means the speed is decreasing – negative acceleration.
- A curved slope means that the acceleration is changing – the object has non-uniform acceleration.
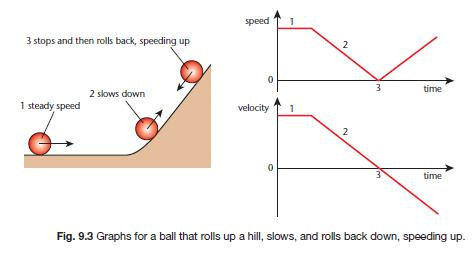
Check carefully whether a graph is a speed-time graph or a distance-time graph.
On true speed–time graphs, the speed has only positive values. On velocity–time graphs the velocity can be negative.
Image
Tachographs are instruments that are put in lorry cabs to check that the lorry has not exceeded the speed limit, and that the driver has stopped for breaks. They draw a graph of the speed against time for the lorry.
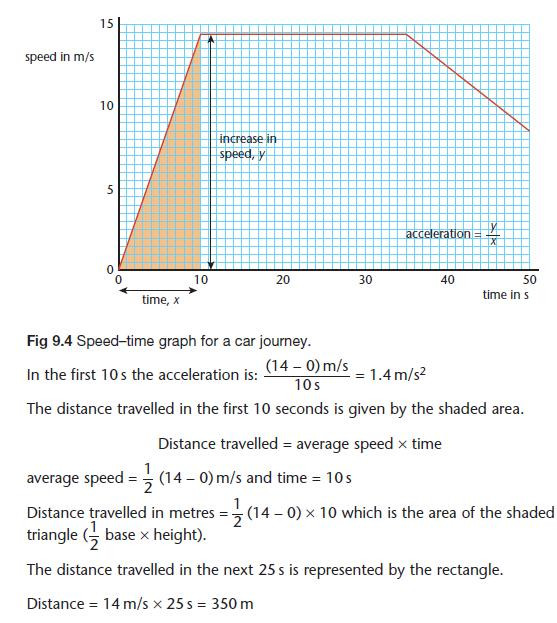
Graphs, acceleration and distance
Image
Image
Image

Category