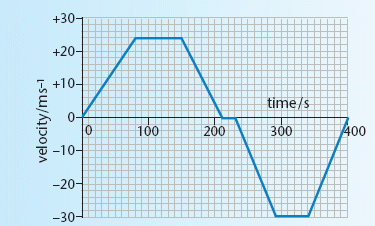
The diagram is a velocity–time graph for a train travelling between two stations. A positive velocity represents motion in the forwards direction.
Image

(a) Calculate the acceleration of the train during the first 80 s. [3]
(b) During which other times shown on the graph is the train increasing speed? [1]
(c) For what length of the time was the train:
(i) not moving? [1]
(ii) travelling at a constant non-zero speed? [1]
(d) Calculate the total distance travelled by the train. [2]
(e) At the end of the time shown on the graph, how far was the train from its starting point?
